Search

As economic uncertainty grows, the ability to anticipate downturns becomes ever more critical. In this article, we explore the most reliable tools and techniques for spotting the first signs of a recession.
By monitoring these indicators, analysts, policymakers, and business leaders can make informed decisions before challenges deepen and navigate turbulent times more effectively.
Recession indicators comprise a range of data points and indexes designed to signal the timing, severity, or probability of an economic downturn. Some of these indicators are leading, coincident, or lagging in nature, reflecting future, current, or past conditions respectively.
No single metric offers perfect foresight; each carries its own strengths and blind spots. To reduce false alarms, experts recommend tracking a basket of indicators rather than relying on one.
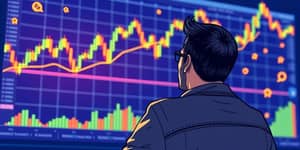
Leading indicators often change direction before the broader economy. When interpreted together, they can provide early warning signals of weakening growth.
These leading indicators often move 6 to 12 months ahead of a downturn. While not foolproof, they have a strong track record of signalling trouble before it arrives.
The Conference Board’s LEI fell by 1.0% in April 2025, following a 0.8% drop in March. Over the past six months ending in April, the index has declined by 2.0%, matching previous half-year declines.
Key components driving this weakness include a monthly deterioration of consumer confidence index and negative contributions from building permits and manufacturing hours. Though the LEI has not triggered an outright recession signal, persistent declines warrant close attention.
Forecasts for U.S. real GDP growth in 2025 have been revised down to 1.6%, well below the 2.8% achieved in 2024. Continued LEI weakness suggests that tariffs and policy uncertainty may weigh heavily on growth in the second half of the year.
A yield curve inversion occurs when yields on short-term government bonds rise above those on longer-term debt. The 10-year vs 2-year Treasury spread and the 10-year vs 3-month T-bill spread are closely watched.
Historically, every U.S. recession since the 1970s has been preceded by a sharp inversion of the Treasury yield curve, with a lead time of 6 to 24 months. This pattern reflects bond market expectations that the Federal Reserve will cut rates to combat slowing growth.
While not a guarantee, an inversion is one of the most reliable recession predictors available.
The unemployment rate and broader labor market indicators are often classified as coincident or lagging. Nevertheless, rising jobless claims and higher unemployment typically accompany economic contractions.
Projections suggest the U.S. unemployment rate could climb to 6% by mid-2026, remaining elevated through 2028 if a downturn occurs. Consumer sentiment, which has fallen steadily since January 2025, further underscores growing household caution.
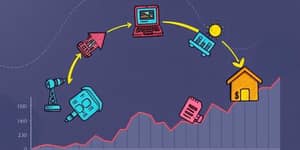
Manufacturing production and construction activity are highly sensitive to changing demand expectations. Declines in new orders, factory output, or building permits often presage broader economic weakness.
In April 2025, both manufacturing hours and new housing permits contributed negatively to the LEI. Monitoring industrial production and business investment orders can also reveal underlying shifts in confidence.
No indicator is infallible. False positives and missed signals can occur due to data revisions, structural shifts, or unique shocks such as pandemics. Interpreting data requires an awareness of inherent limitations and blind spots.
Monetary and fiscal policy responses can alter indicator behavior. For example, aggressive rate cuts may steepen the yield curve even as growth slows, complicating traditional signals.
For a comprehensive view, analysts should combine multiple indicators that cover different economic dimensions. Below is a practical summary table.
Combining the basket of diverse indicators and metrics reduces the risk of misinterpretation and enhances the overall accuracy of forecasts.
Forecasting a recession is as much art as science. By carefully monitoring leading indexes, yield curves, labor data, and sentiment measures, stakeholders can gain precious time to adjust strategies.
Stay vigilant, update your data sources regularly, and perform scenario analysis to stress-test your assumptions. With proactive planning and careful interpretation using multiple indicators, you can better navigate the next economic cycle and protect against unforeseen downturns.
References